Dagstuhl Seminar 24091
Reflections on Pandemic Visualization
( Feb 25 – Mar 01, 2024 )
Permalink
Organizers
- Daniel Archambault (Newcastle University, GB)
- Fintan McGee (Luxembourg Inst. of Science & Technology, LU)
- Simone Scheithauer (Universitätsmedinzin Göttingen, DE)
- Tatiana von Landesberger (Universität Köln, DE)
Contact
- Marsha Kleinbauer (for scientific matters)
- Christina Schwarz (for administrative matters)
Impacts
- Reflections on the Use of Dashboards in theCOVID-19 Pandemic - Arleo, Alessio; Borgo, Rita; Kohlhammer, Jörn; Ruddle, Roy A.; Scharlach, H.; Yuan, Xiaoru - Los Alamitos : IEEE, 2025. - pp. 135-142 - (IEEE computer graphics ; 45. 2025, 2 : article).
- Preparedness for Visualization in the Next Pandemic - McGee, Fintan; Abu Sin, Muna; Chen, Min; Ebert, David S.; Ritsos, Panagiotis D.; Misue, Kazuo; Wulff, Antje - Los Alamitos : IEEE, 2025. - pp. 95-103 - (IEEE computer graphics and applications ; 45. 2025, 3 : article).
- Empowering Communities : Tailored Pandemic Data Visualization for Varied Tasks and Users - Baumgartl, Tom; Ghoniem, Mohammad; Landesberger, Tatiana von; Marai, G. Elisabeta; Miksch, Silvia; Mohr, Sibylle; Scheithauer, Simone; Srivastava, Nikita - London : IEE, 2025. - pp. 130-138 - (IEEE computer graphics and applications ; 45. 2025, 1 : article).
- Embarrassingly Agile-Data VisualizationMethodology in Emergency Responses - Kozlíková, Barbora; Archambault, Daniel; Dreesman, Johannes; Kerren, Andreas; Lucini, Biagio; Turkay, Cagatay - Los Alamitos : IEEE, 2025. - pp. 138 - 146 - (IEEE computer graphics ; 45. 2025, 5 : article).
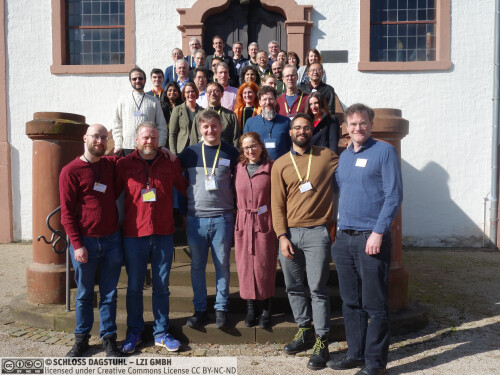
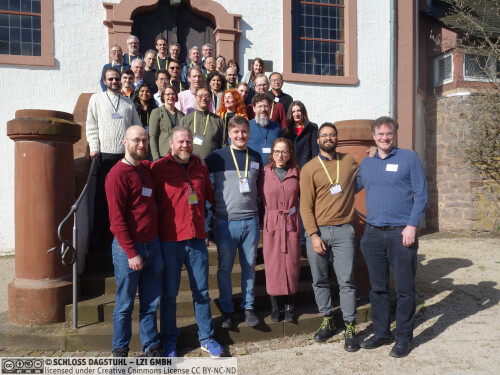
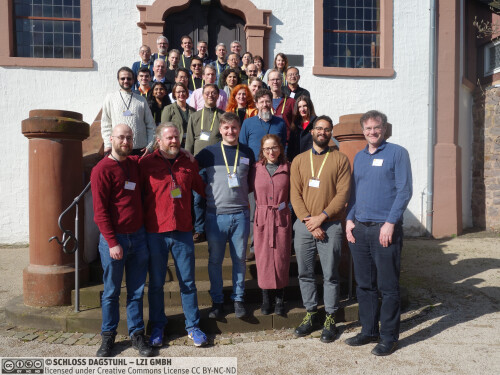
During the recent SARS-CoV-2 pandemic, visualizations were omnipresent, playing a central role in communicating with the public, drawing from multiple data sources, and serving diverse goals. In a short period, public health messages spread globally. In this Dagstuhl Seminar, we brought together 37 experts in visualization, mathematics, modeling, public health, infectious diseases, and psychology from Europe, Asia, Australia, and North America to summarize and discuss their personal insights gained over the three years of the pandemic.
Due to the heterogeneity of expertise and different tasks performed by each individual during the pandemic, and despite intensive collaboration and contact between experts in both fields over the past three years, it was felt necessary to establish some common ground for the work and concepts of both medical and visualization experts. The first two days of the seminar included short talks on public health, infectious diseases, modeling, big data, and an overview of visualizations that participants used or appreciated during the SARS-CoV-2 pandemic. These introductory talks were specially designed to foster discussions and personal exchange, allowing significant time for in-depth conversations. After engaging discussions during and after the sessions, several key topics emerged across the medical and visualization fields that require deeper reflection. The organizers then clustered these relevant topics into five overarching areas of interest: the use of dashboards during the pandemic, communication to the public, preparedness, data visualization methodology in emergency responses and users tasks and medium.
Over the last two days of the seminar, breakout sessions of six participants were created to work on these key issues. The fruitful discussions in the breakout sessions had as their first output a presentation by each group summarizing their discussions. These discussions will be extended into a second output in the form of several publications that will appear in a Computer Graphics and Applications issue later this year which are now in preparation. Important connections were made between experts in healthcare-related disciplines and visualization specialists, addressing a significant need. As a result, one of the organizers was invited to participate in a symposium on automated surveillance of bloodstream infections in Germany, which was promptly accepted. We look forward to hosting more interdisciplinary seminars, which are extremely rewarding and valuable.
 Daniel Archambault, Fintan McGee, Simone Scheithauer, and Tatiana von Landesberger
The global fight against the COVID-19 pandemic has presented massive challenges and real opportunities for data science and visualization research and technology. Epidemiologists, virologists, infection control experts and public health officials are required to make sense of information from a huge variety of data sources. Physicians and medical researchers have access to rapidly changing medical data as the pandemic evolves. Political stakeholders (supported by economists, public health officials, and other experts analyzing the data) make decisions on which action to take, balancing the impact on public health with social and economic impacts. The general public is regularly presented with visualization, through news, conventional and social media, and government publications, and these inform their actions for the next days and weeks.
Visualization has played, and continues to play, a key role in the pandemic response. The pandemic has tested all areas of data science more rigorously than ever before, from data collection and analytics through to visualization. The widely varying end users with different tasks and priorities require immediate solutions. Thus, new methods, tools, and methodologies from basic and applied research have been and still are needed. Significant funding has been made available in response to the pandemic for research related to COVID-19. Many researchers in information visualization, and data modelling, in cooperation with end users (epidemiologists, virologists, infection preventionists, economists, and other medical experts) have worked on projects related to the pandemic in multidisciplinary teams.
These unique circumstances mean that novel methodologies and visualization approaches and tools have been developed, extended, and validated with real world data and applications. Much of the time since the initial outbreak has been characterized by emergency response without the time for reflection. Schloss Dagstuhl’s objective to promote the transfer of knowledge between research into informatics and application of informatics, make it an ideal venue to host a seminar focused on consolidating the knowledge gained during the COVID-19 crisis and ensuring that the knowledge is available for those who want to apply it in the ongoing fight against COVID-19 and for future global emergencies.
The purpose of this Dagstuhl Seminar is to bring the visualization community, modelling experts, epidemiologists, infection control experts, and end users together with other application domain experts to reflect on research work done in response to the COVID-19 pandemic. Our goal is to ensure that the lessons and experience of the pandemic are not lost, and that researchers can learn lessons from this pandemic to help address future and contemporary crises, adapting to end user needs for visualization and visual data analysis. The Dagstuhl environment provides an excellent platform for exchange of experiences, often resulting in new collaborations and research ideas. The outcome of this seminar is a book that will answer the following research question:
What are the learnt lessons and experiences of the pandemic in terms of data visualization that will best help the response for future pandemics?
 Daniel Archambault, Fintan McGee, Simone Scheithauer, and Tatiana von Landesberger
- Muna Abu Sin (RKI - Berlin, DE)
- Daniel Archambault (Newcastle University, GB) [dblp]
- Alessio Arleo (TU Eindhoven, NL) [dblp]
- Tom Baumgartl (Universität Köln, DE)
- Rita Borgo (King's College London, GB) [dblp]
- Min Chen (University of Oxford, GB) [dblp]
- Johannes Dreesman (Niedersächsisches Landesgesundheitsamt - Hannover, DE)
- David S. Ebert (University of Oklahoma - Norman, US) [dblp]
- Mohammad Ghoniem (Luxembourg Inst. of Science & Technology, LU) [dblp]
- Andreas Kerren (Linköping University, SE) [dblp]
- Jörn Kohlhammer (Fraunhofer IGD - Darmstadt, DE) [dblp]
- Barbora Kozlíková (Masaryk University - Brno, CZ) [dblp]
- Tatiana Losev (Simon Fraser University - Surrey, CA) [dblp]
- Biagio Lucini (Swansea University, GB) [dblp]
- Georgeta Elisabeta Marai (University of Illinois - Chicago, US) [dblp]
- Fintan McGee (Luxembourg Inst. of Science & Technology, LU) [dblp]
- Nicolas Medoc (Luxembourg Inst. of Science & Technology, LU) [dblp]
- Silvia Miksch (TU Wien, AT) [dblp]
- Kazuo Misue (University of Tsukuba, JP) [dblp]
- Sibylle Mohr (University of Glasgow, GB) [dblp]
- Klaus Mueller (Stony Brook University, US) [dblp]
- Mathias Pletz (Universitätsklinikum Jena, DE)
- Huamin Qu (HKUST - Hong Kong, HK) [dblp]
- Nicolas Reinoso-Schiller (Universitätsmedinzin Göttingen, DE)
- Panagiotis Ritsos (Bangor University, GB)
- Roy Ruddle (University of Leeds, GB) [dblp]
- Holger Scharlach (Niedersächsisches Landesgesundheitsamt - Hannover, DE)
- Simone Scheithauer (Universitätsmedinzin Göttingen, DE) [dblp]
- Max Sondag (Universität Köln, DE)
- Nikita Srivastava (Universitätsmedinzin Göttingen, DE)
- Cagatay Turkay (University of Warwick - Coventry, GB) [dblp]
- Tatiana von Landesberger (Universität Köln, DE) [dblp]
- Yong Wang (SMU - Singapore, SG) [dblp]
- Antje Wulff (Universität Oldenburg, DE)
- Michael Wybrow (Monash University - Clayton, AU) [dblp]
- Xiaoru Yuan (Peking University, CN) [dblp]
- Hajo Zeeb (BIPS - Bremen, DE) [dblp]
Classification
- Data Structures and Algorithms
- Human-Computer Interaction
- Other Computer Science
Keywords
- Data Visualization
- Epidemiology
- Graph Visualization
- Visual Analytics
- Social Network Analysis
- Complex Systems
- Geographic Networks
- Modelling


 Creative Commons BY 4.0
