Dagstuhl Seminar 22031
Bringing Graph Databases and Network Visualization Together
( Jan 16 – Jan 21, 2022 )
Permalink
Organizers
- Karsten Klein (Universität Konstanz, DE)
- Juan F. Sequeda (data.world - Austin, US)
- Hsiang-Yun Wu (FH - St. Pölten , AT)
- Da Yan (The University of Alabama - Birmingham, US)
Contact
- Michael Gerke (for scientific matters)
- Simone Schilke (for administrative matters)
Network analytics through interactive network visualization has been essential in many research and application areas, such as bioinformatics, biomedicine, cyber security, e-commerce, social science, and software engineering. A network is often supported by graph databases with advanced query engines and indexing techniques. Graph databases have substantial contributions by academia and gained strong momentum in the industry, where the focus is on scalable systems using graph query languages that require to be learned by users. Even though the Graph Database and Network Visualization communities study the same object, a graph/network, albeit from different perspectives, they do not communicate with each other. By bringing both communities together, we aimed to initiate and foster mutual communication and joint work. The goal of this seminar was to initiate collaborative efforts, to increase the mutual awareness of each others' existing concepts and technologies, and to identify new and complementary research challenges that lead to novel scientific outcomes. We have developed the schedule for the seminar based on our experience from previous successful Dagstuhl Seminars with a balance between prepared talks, plenary discussions, and breakout groups for less structured discussions focused on a selection of highly relevant topics.
The organizers envisioned several core topics for discussion at the Dagstuhl Seminar, as outlined in the proposal:
- Integration of fundamental concepts used in the two communities
- Visual scalability and computational performance
- Visual graph query paradigm
- Responsive visualization of graph query results
- (Qualitative) Evaluation
- Domain-oriented applications
During the plenary discussions on the first day, the participants identified several more specific topics for the work in separate working groups, which lead to the following working group titles:
- Evaluation and Usefulness
- Understanding gaps and opportunities between Graph Databases and Network Visualization
- Visual querying and result visualization
Our aim was to have focused discussions on these topics in which we would be able to make significant progress during the seminar, in order to shape a position paper and to lay the foundations for subsequent collaborations. The discussions showed that there indeed is the need for a closer exchange between the communities in order to improve the mutual understanding and practical solutions, but also to identify research questions that can be tackled jointly. They however also showed the great potential in this exchange and the large interest in both communities for joint work.
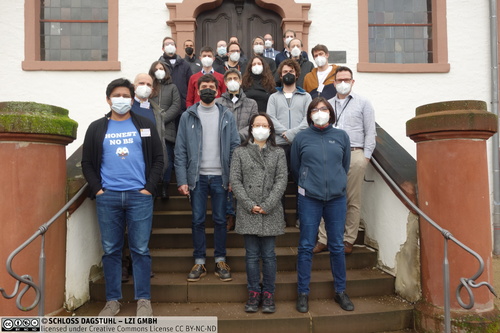
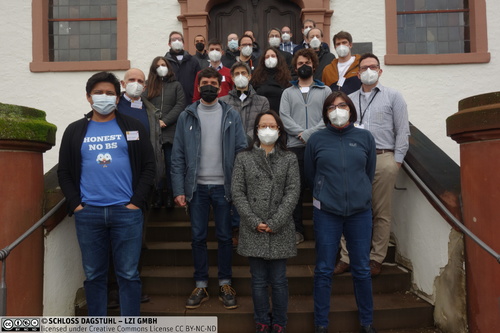
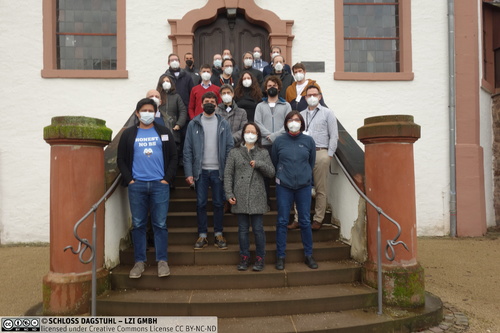
We have organized the seminar during the COVID-19 pandemic. Due to various regulations and travel restrictions, only roughly half of the usual number of participants attended in person. The meeting was held purely on-site, with the exception of one participant connecting in via video conferencing. We thank Dagstuhl for equipping the seminar rooms with suitable infrastructure and for putting suitable health and safety regulations in place to create a smooth experience and safe environment for all participants.
Acknowledgements
We would like to thank all participants of the seminar for their contributions and lively discussions, and the scientific directorate of Dagstuhl for providing us with the opportunity to organize this seminar. Finally, the seminar would not have been possible without the amazing support by the staff of Dagstuhl.
 Karsten Klein, Juan F. Sequeda, Hsiang-Yun Wu, and Da Yan
Network analytics through interactive network visualization has been essential in many research areas, such as bioinformatics, social science, and knowledge graph exploration. A network is often supported by graph databases with advanced query engines and indexing techniques. Graph databases have substantial contributions by academia and gained strong momentum in the industry, where the focus is on scalable systems using graph query languages that require to be learned by users. Even though the Graph Database and Network Visualization communities study the same object, a graph/network, albeit from different perspectives, they do not communicate with each other. By bringing both communities together, we aim to initiate and foster mutual communication and joint work. The goal of this Dagstuhl Seminar is to initiate collaborative efforts, to increase the mutual awareness of each other's existing concepts and technologies, and to identify new and complementary research challenges that lead to novel scientific outcomes. The organizers envision several core topics for discussion at the Dagstuhl Seminar:
- Integration of fundamental concepts used in the two communities. We aim to review concepts and materials that have been separately developed or extensively used in each community, and to establish a road map to mutually guide the follow-up research in both or other communities.
- Visual scalability and computational performance. We want to investigate the specific requirements of use-cases associated with graph databases, as well as integrative approaches such as better database structure support for visual interactions or better update schemes through visualizations.
- Visual graph query paradigm. We aim to discuss if conceptual patterns in a user’s mind can be visually formulated, and further be converted to text-based queries for graph databases, as an alternative method to explore and mine large graphs without getting lost.
- Responsive visualization of graph query results. Graph queries aim to search and identify patterns, such as pattern matching, neighbors, paths, and cliques in graph databases. More sophisticated query cases for pattern or visual pattern detection will be discussed.
- (Qualitative) Evaluation. We plan to integrate and share the evaluation experience in network visualization and exchange these experiences with the graph database community. Moreover, a more sophisticated evaluation for the integration of visualization and data management will be researched.
- Domain-oriented applications. Several domain-specific applications that utilize graph databases and network visualization for analytics purposes will be investigated, identifying current weaknesses and exploring new concepts to better support research in the application domains.
This Dagstuhl Seminar aims for bringing together leading researchers with core expertise from two distinct communities, including both industry and academia. The seminar serves to establish a common understanding of the state of the art and the terminology in both communities, and to connect participants to tackle joint research challenges as described above. The contributions of the seminar include identifying the top areas of research interest, developing the research challenges and research questions, investigating selected problems, and possibly drafting a vision paper on joint research.
 Karsten Klein, Juan F. Sequeda, Hsiang-Yun Wu, and Da Yan
- Michael Behrisch (Utrecht University, NL & GraphPolaris.com Analytics Platform) [dblp]
- Walter Didimo (University of Perugia, IT) [dblp]
- Nadezhda T. Doncheva (University of Copenhagen, DK) [dblp]
- Henry Ehlers (TU Wien, AT)
- George Fletcher (TU Eindhoven, NL) [dblp]
- Carsten Görg (University of Colorado - Aurora, US) [dblp]
- Katja Hose (Aalborg University, DK) [dblp]
- Karsten Klein (Universität Konstanz, DE) [dblp]
- Pavel Klinov (Stardog - Arlington, US)
- Stephen Kobourov (University of Arizona - Tucson, US) [dblp]
- Oliver Kohlbacher (Universität Tübingen, DE) [dblp]
- Giuseppe Liotta (University of Perugia, IT) [dblp]
- Fabrizio Montecchiani (University of Perugia, IT) [dblp]
- Sebastian Müller (yWorks GmbH - Tübingen, DE)
- Catia Pesquita (University of Lisbon, PT)
- Falk Schreiber (Universität Konstanz, DE) [dblp]
- Juan F. Sequeda (data.world - Austin, US) [dblp]
- Hannes Voigt (Neo4j - Leipzig, DE) [dblp]
- Tatiana von Landesberger (Universität Köln, DE) [dblp]
- Markus Wallinger (TU Wien, AT)
- Hsiang-Yun Wu (FH - St. Pölten , AT) [dblp]
- Da Yan (The University of Alabama - Birmingham, US) [dblp]
Classification
- Data Structures and Algorithms
- Databases
- Human-Computer Interaction
Keywords
- graph databases
- network visualization
- visual analytics


 Creative Commons BY 4.0
