Dagstuhl-Seminar 22331
Visualization and Decision Making Design Under Uncertainty
( 15. Aug – 19. Aug, 2022 )
Permalink
Organisatoren
- Nadia Boukhelifa (INRAE - Palaiseau, FR)
- Christopher R. Johnson (University of Utah - Salt Lake City, US)
- Kristi Potter (NREL - Golden, US)
Kontakt
- Michael Gerke (für wissenschaftliche Fragen)
- Christina Schwarz (für administrative Fragen)
Impacts
- Visual Validation versus Visual Estimation : Study on the Average Value in Scatterplots : author’s version of the article that has been published in the proceedings of IEEE Visualization conference 2023 - Braun, Daniel; Suh, Ashley; Chang, Remco; Gleicher, Michael; Landesberger, Tatiana von - 2023. - 5 pp...
- Visual Validation versus Visual Estimation : A Study on the Average Value in Scatterplots - Braun, Daniel; Suh, Ashley; Chang, Remco; Gleicher, Michael; Landesberger, Tatiana von - Cornell University : arXiv.org, 2023. - 5 pp..
- A Problem Space for Designing Visualizations : article - Gleicher, Michael; Riveiro, Maria; Landesberger, Tatiana von; Deussen, Oliver; Chang, Remco; Gillmann, Christina - Los Alamitos : IEEE, 2023. - pp. 111 - 120 - (IEEE computer graphics ; 43. 2023, 4).
- Beware of Validation by Eye : Visual Validation of Linear Trends in Scatterplots - Braun, Daniel; Chang, Remco; Gleicher, Michael; Landesberger, Tatiana von - Cornell University : arXiv.org, 2024. - 11 pp..
Programm
Uncertainty is an important aspect to data understanding. Without awareness of the variability, error, or reliability of a data set, the ability to make decisions on that data is limited. However, practices around uncertainty visualization remain domain-specific, rooted in convention, and in many instances, absent entirely. Part of the reason for this may be a lack of established guidelines for navigating difficult choices of when uncertainty should be added, how to visualize uncertainty, and how to evaluate its effectiveness. Unsurprisingly, the inclusion of uncertainty into visualizations is a major challenge to visualization [1]. As work concerned with uncertainty visualization grows, it has become clear that simple visual additions of uncertainty information to traditional visualization methods do not appropriately convey the meaning of the uncertainty, pose many perceptual challenges, and, in the worst case, can lead a viewer to a completely wrong understanding of the data.
The goal of this Dagstuhl Seminar was to bring together experts with diverse knowledge of uncertainty visualization and comprehension toward building a foundation of accessible, practical knowledge that practitioners and researchers alike can rely on in addressing challenges related to uncertainty. Specifically, this seminar brought together leaders in the field of uncertainty visualization and communication, along with experts on quantification and practitioners and domain experts dealing with uncertainty on a daily basis. Drawing on the knowledge of the participants, the seminar worked toward goals of synthesizing disparate findings and approaches from across computer science and related literature, noting current practices surrounding uncertainty, and identifying unsolved problems in common workflows, and areas needing further study.
As a major result from the seminar, the following challenges and research topics in visualization and decision making under uncertainty have been identified:
- Applications,
- Human-centered uncertainty visualization (including how to support "feeling uncertain"),
- A design process for uncertainty visualization,
- Defining terms related to uncertainty,
- Algorithms and uncertainty quantification,
- Software dissemination,
- User studies,
- Ethics of uncertainty (when to include uncertainty information),
- Surveys of uncertainty-aware visual analytics, and
- Teaching uncertainty visualization.
The top three challenges were discussed in depth during this intensive three and a half days Dagstuhl Seminar as part of the break-out groups, and are further discussed in this report. In particular, the break-out groups examined uncertainty visualization research challenges from three complementary perspectives: from an application viewpoint looking at how uncertainty visualization and assessment are used in many domains; from a human-centered perspective considering the needs and information of the viewer; and from a more theoretical stand focusing on the problem space for designing uncertainty visualization.
The seminar ended with a presentation from each group and discussions on the next steps. Interesting research questions and potential solutions were identified during the discussions, and plans were made to continue the collaboration. Details of the individual talks and break-out group discussions are provided in this report.
References
- Chris R. Johnson and Allen R. Sanderson. A next step: Visualizing errors and uncertainty. IEEE Computer Graphics and Applications, 2003, vol. 23, no 5, p. 6-10.
 Nadia Boukhelifa, Christopher R. Johnson, and Kristi Potter
Visualization has become a core component of any decision or risk analysis pipeline, and tools for creating visualizations are quickly becoming more and more accessible. In addition, the visual literacy of the general public has been increasing due to the pervasiveness of visualizations in everyday life. As the appetite for decision making tools grows, so does the need to convey error, confidence, missing, or conflicting data visually. However, practices around uncertainty visualization remain domain-specific, rooted in convention, and in many instances, absent entirely.
The goal of this Dagstuhl Seminar is to bring together experts with diverse knowledge of uncertainty visualization and comprehension toward building a foundation of accessible, practical knowledge that practitioners and researchers alike can rely on in addressing challenges related to uncertainty. Specifically, this seminar aims to bring together leaders in the field of uncertainty visualization and communication, along with experts on quantification and practitioners and domain experts dealing with uncertainty on a daily basis. Drawing on the knowledge of the participants, the seminar will work toward goals of synthesizing disparate findings and approaches from across computer science and related literature, noting current practices surrounding uncertainty, and identifying unsolved problems in common workflows, and areas needing further study. We plan to discuss three major topics related to challenges in visualization and decision making under uncertainty: Representation & Modeling, Comprehension and Social factors.
Representation & Modeling Challenges - Types of Uncertainty: Uncertainty comes in many forms. Can we develop a taxonomy of uncertainty types to help define categories that may be treated in a similar fashion? Big Data Problems: Many of the techniques to handle big data use data fusion, summarizations, sampling, or clustering, all of which introduce uncertainties. How can we handle these various sources of uncertainty? Do new algorithms need to be developed, or can we better use quantification and statistical methods already in play? Propagation: Uncertainty arises in all stages of the decision making pipeline. Is there a way to better understand these uncertainties and provide guidelines to how these different stages of uncertainty affect understanding and decisions?
Comprehension Challenges - Decision Making and Risk Analysis: Though decision making under uncertainty and risk are well studied fields unto themselves, the unique characteristics of decision making and analysis from visualizations raise questions that remain unanswered in those bodies of literature. For example, how does a visual channel change the perceived salience of uncertainty or risk relative to text presentations? Understanding User Differences: Risk interpretation changes from person to person, as does statistical literature. What do we know about the impacts of user characteristics and can we define guidelines for designing for specific audiences? Perception: How can we better understand the perceptual system’s strengths and leverage those for uncertainty visualization?
Social Challenges: Ethical Risks & Incentives: Depending on the situation, conveying uncertainty may not add value for users or decision-makers, may conflict with the visualization author’s incentives, or may have other ethical implications. What are common uncertainty communication scenarios where incentives and ethics may collide? Collaboration: Decision making is often a collaborative process that involves different types and levels of expertise. How can we design uncertainty visualizations that take into account the cognitive and relational levels within teams of decision makers? What are the triggers and barriers for revealing and communicating uncertainty in a collaborative context?
 Nadia Boukhelifa, Christopher R. Johnson, and Kristi Potter
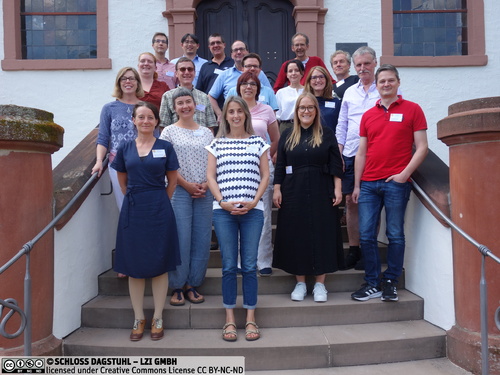
- Michael Böttinger (DKRZ Hamburg, DE) [dblp]
- Nadia Boukhelifa (INRAE - Palaiseau, FR) [dblp]
- Remco Chang (Tufts University - Medford, US) [dblp]
- Oliver Deussen (Universität Konstanz, DE) [dblp]
- Christina Gillmann (Universität Leipzig, DE) [dblp]
- Amy Gilmer (USGS - Denver, US)
- Michael Gleicher (University of Wisconsin-Madison, US) [dblp]
- Hans-Christian Hege (Zuse-Institute Berlin, DE) [dblp]
- Christoph Heinzl (Universität Passau, DE) [dblp]
- Miriah Meyer (Linköping University, SE) [dblp]
- Kristi Potter (NREL - Golden, US) [dblp]
- Maria Riveiro (Jönköping University, SE) [dblp]
- Gerik Scheuermann (Universität Leipzig, DE) [dblp]
- Johanna Schmidt (VRVis - Wien, AT) [dblp]
- Thomas Schultz (Universität Bonn, DE) [dblp]
- Regina Maria Veronika Schuster (Universität Wien, AT)
- Jarke J. van Wijk (TU Eindhoven, NL) [dblp]
- Tatiana von Landesberger (Universität Köln, DE) [dblp]
- Stefan Hagen Weber (Siemens - München, DE)
- Tushar Athawale (Oak Ridge National Laboratory, US)
- Mehdi Chakhchoukh (INRAE Paris, FR) [dblp]
- Michael Correll (Tableau Software - Seattle, US) [dblp]
- Stephanie Deitrick (Arizona State University - Tempe, US) [dblp]
- Jake Hofman (Microsoft - New York, US) [dblp]
- Amit Jena (Indian Institute of Technology Bombay, IN) [dblp]
- Christopher R. Johnson (University of Utah - Salt Lake City, US) [dblp]
- Matthew Kay (Northwestern University - Evanston, US) [dblp]
- Robert Lempert (RAND - Santa Monica, US)
- Paul Rosen (University of Utah - Salt Lake City, US) [dblp]
- Han-Wei Shen (Ohio State University - Columbus, US) [dblp]
- Brian Summa (Tulane University - New Orleans, US) [dblp]
- Kathleen Warrell (UCAR - Boulder, US)
- Thomas Wischgoll (Wright State University - Dayton, US) [dblp]
- Xiaoru Yuan (Peking University, CN) [dblp]
- Liang Zhou (Peking University, CN)
Klassifikation
- Computers and Society
- Graphics
- Other Computer Science
Schlagworte
- Uncertainty Visualization
- Uncertainty Quantification
- Risk Analysis
- Decision Making Under Uncertainty


 Creative Commons BY 4.0
