Dagstuhl-Seminar 24301
Art, Visual Illusions, and Data Visualization
( 21. Jul – 26. Jul, 2024 )
(zum Vergrößern in der Bildmitte klicken)
Permalink
Bitte benutzen Sie folgende Kurz-Url zum Verlinken dieser Seite:
https://www.dagstuhl.de/24301
Organisatoren
- Claus-Christian Carbon (Universität Bamberg, DE)
- Christophe Hurter (ENAC - Toulouse, FR)
- Mauro Martino (MIT-IBM Watson AI Lab - Cambridge, US)
- Bernice E. Rogowitz (Visual Perspectives - New York, US)
Kontakt
- Michael Gerke (für wissenschaftliche Fragen)
- Simone Schilke (für administrative Fragen)
Gemeinsame Dokumente
- Dagstuhl Materials Page (Use personal credentials as created in DOOR to log in)
Art, visual illusions, and data science are seemingly disparate fields, but they are deeply intertwined. Art has always been a means of visual expression and communication of complex narratives. Visual illusions have captivated audiences for centuries with their ability to “trick the eye,” and challenge our perceptions, but also to teach the beholders about cognitive and perceptual functioning in a joyful and compact way. Data science offers powerful tools for analyzing and interpreting diverse and large data sets, using novel visualization metaphors to provide insight and new perspectives. These three disciplines offer different approaches to understanding the relationship between the visual representation and its perception. The goal of this seminar was to provide a forum for exploring synergies between these diverse disciplines. This premise is built on a strong foundation. There is a long history of artists incorporating visual illusions in their art to challenge audience perceptions Some examples include Robert Delaunay’s explorations of color contrast; Victor Vasarely’s spatial illusions; Bridget Riley’s optical illusions; Salvador Dalí’s spatial sampling illusions; M.C. Escher’s impossible constructions; Giuseppe Arcimboldo’s composite portraiture; Yayoi Kusama’s infinity rooms; Hans Holbein the Younger’s anamorphic art; and Patrick Hughes’s reverse perspective paintings. Contemporary artists now use data science to create works that explore hidden patterns and relationships in complex data sets. Examples include Laurie Frick’s use of self-tracking information gathered from personal devices to create hand-built works and installations; Jenny Odell’s combination of satellite images to create collages revealing patterns in human-made structures; Refik Anadol’s use of datasets from EEG brainwave patterns and machine learning algorithms to create immersive, data-driven installations exploring memory and cognitive processes; Nathalie Miebach’s intricate, threedimensional sculptures visualizing climate change data and its impact on weather patterns; Giorgia Lupi and Stefanie Posavec’s hand-drawn visualizations of personal data exchanged through postcards over the course of a year; Aaron Koblin’s visualization of airplane flight paths across the United States, creating mesmerizing patterns that reveal the complexity of air traffic; Onformative’s use of face detection algorithms to search for human-like faces in satellite images from Google Earth, exploring pareidolia and pattern recognition; Ingo Günther’s illuminated globes that visualize various datasets such as population density, energy consumption, and military spending; and Ben Rubin and Mark Hansen’s collection and display of real-time text fragments from internet chat rooms and forums, revealing the ebb and flow of online conversations. Visualization researchers explore spatial, temporal, and color metaphors to represent complex data and relationships (Brooks, 1988), and are increasingly turning to visual arts and perceptual psychology for new ways to communicate complex data in more intuitive and engaging ways. This seminar brought together artists, perceptual and cognitive psychologists, and computer scientists active in the data science fields of visualization and artificial intelligence, who are not only experts in their own fields, but whose work has actively crossed discipline boundaries. Our format encouraged the organic evolution of these connections and synergies.
 Creative Commons BY 4.0
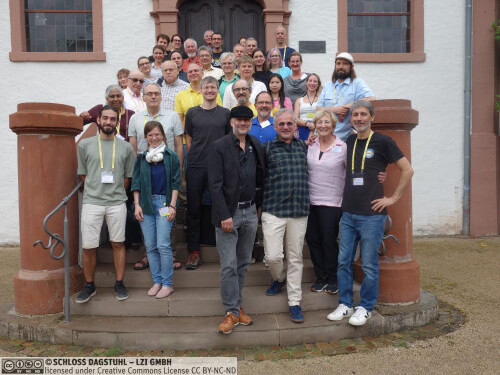
 Christophe Hurter, Claus-Christian Carbon, Mauro Martino, and Bernice E. Rogowitz
Art, visual illusions, and data science may appear as unrelated fields at first glance, but they are profoundly interconnected. Art has always served as a means of visual expression and communication. Optical illusions, with their ability to “deceive” the eye have fascinated audiences for centuries and have stimulated advances in perceptual science. Data science provides potent tools for analyzing and interpreting diverse datasets, offering insights and fresh perspectives on a wide range of subjects. When these three domains converge, the outcome can be truly groundbreaking. Contemporary artists are now harnessing data science to craft works that reveal concealed patterns and relationships within complex datasets, incorporating visual illusions to challenge the audience's perceptions. Data science researchers are increasingly embracing the visual arts to convey complex data and ideas in more accessible and engaging manners.
This multidisciplinary Dagstuhl Seminar offers a unique opportunity to bring together leading scientists, designers, and artists to explore the emerging perceptions that arise in art, visual illusions, and data visualization. The goal is to expand our intellectual horizons and enrich our perspectives. This seminar aims to push the limits of scientific and artistic creativity, inspiring new tools, and approaches for artistic creation, stimulating new methods for visualizing data, and inspiring a research roadmap for multidisciplinary research in this area.
The seminar will involve plenary discussions and group work, with invited talks focusing on art, perception, cognition, and data visualization at their intersections. Time will be allocated for organic question generation before forming focused groups. Initial days will establish research questions and projects through self-introductions and invited talks to bridge knowledge gaps. Working group topics will emerge both from organizers' ideas and participants' contributions. Progress will be shared among groups to encourage interaction, and participants will maintain accessible online records of their work for cross-group collaboration, aiding in final reports and future publications.
Two special events are planned for the seminar. Firstly, there will be daily "Lightning Talks" lasting 5-10 minutes each, featuring recent results or ideas from related fields. Participants are encouraged to prepare materials, and some talks will be scheduled in advance, with room for spontaneous contributions to keep the seminar dynamic. Additionally, an "Art and Illusion Demos" section will showcase artistic works and perceptual effects that can inspire data visualization, as well as visualization methods that can inspire artists and perceptual psychologists.
The fusion of art, optical illusions, and data science constitutes an intriguing and captivating research field. This seminar will help shape an understanding of its synergies and boundaries, and guide our ability to enhance its power, replicability, fairness, and reliability.
Claus-Christian Carbon, Christophe Hurter, Mauro Martino, and Bernice E. Rogowitz
Please log in to DOOR to see more details.
- Kim Albrecht (Filmuniversität Babelsberg - Potsdam, DE)
- Michael Bach (Universität Freiburg, DE)
- Michele Banks (Washington, US)
- Marco Bertamini (University of Padova, IT) [dblp]
- Alina Braun (BMW Group - München, DE)
- Claus-Christian Carbon (Universität Bamberg, DE) [dblp]
- Shanthi Chandrasekar (North Potomac, US)
- Oliver Deussen (Universität Konstanz, DE) [dblp]
- Peter Eades (The University of Sydney, AU) [dblp]
- Brian D. Fisher (Simon Fraser University - Surrey, CA) [dblp]
- Itay Goetz (Universität Bamberg, DE)
- Ludwig Hanisch (Nürnberg, DE)
- Christophe Hurter (ENAC - Toulouse, FR) [dblp]
- Sophia Huth (Berlin, DE)
- Stephen Kobourov (TU München, DE) [dblp]
- Jürgen Kornmeier (IGPP - Freiburg, DE)
- Bodo Korsig (Trier, DE)
- Michael Kubovy (University of Virginia - Charlottesville, US) [dblp]
- Karina Kueffner (Nürnberg, DE)
- Kassandra R. Lee (University of Nevada - Reno, US) [dblp]
- Mauro Martino (MIT-IBM Watson AI Lab - Cambridge, US) [dblp]
- Fiona Menzel (Technische Hochschule Würzburg Schweinfurt, DE)
- Mario Alexis Emilio Michelessa (National University of Singapore, SG)
- Arthur I. Miller (University College London, GB)
- Claudia Muth (Universität Hof - Münchberg, DE)
- Alexander Pastukhov (Universität Bamberg, DE) [dblp]
- Rebecca Pfiffer (freakstotable e.V. - Wirsberg, DE)
- Sylvia Pont (TU Delft, NL) [dblp]
- Marius Raab (Technische Hochschule Nürnberg Georg Simon Ohm, DE) [dblp]
- Brian Rogers (University of Oxford, GB)
- Bernice E. Rogowitz (Visual Perspectives - New York, US) [dblp]
- Arthur Shapiro (American University - Washington, US)
- Ahna Skop (University of Wisconsin - Madison, US)
- Dejan Todorovic (University of Belgrade, RS) [dblp]
- Jan Willem Tulp (TULP interactive - Rijswijk, NL)
- Boyu Xu (Utrecht University, NL) [dblp]
- Rebecca Ruige Xu (Syracuse University, US) [dblp]
Klassifikation
- Artificial Intelligence
- Graphics
- Human-Computer Interaction
Schlagworte
- Data visualization
- perception
- art
- visual illusions
- artificial intelligence